Preferred Future
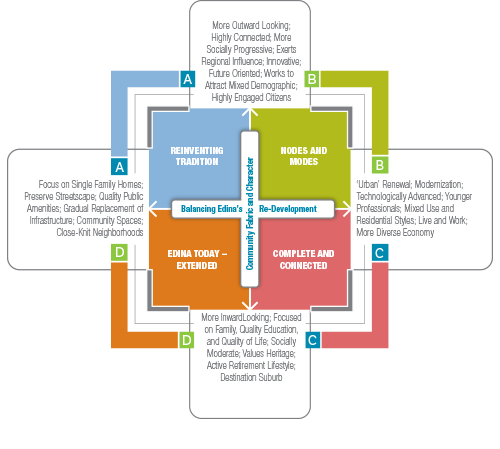
The scatterplot presented depicts the survey respondents’ preferences for one of the four scenario outcome spaces defined in the Vision Edina Think Tank workshop. Two coordinate values were estimated for each respondent in order to place them in this space. These values were calculated using a weighted averaging technique to blend the responses to each of the eight issue-related questions presented on this data visualization platform. The x-axis, or horizontal value was calculated using answers to the first four questions, and the y-axis, or vertical value was calculated using responses to the final four questions.
The dropdown menus to the upper right of the scatterplot can be used to adjust the distribution of responses by selecting one or more filtering criteria such as age, gender, area of residence, and length of time residing in the city.
Vision Edina Preferred Future
- The preferred consensus points that are defined by the average value of each of the respondent assignments vary as different filtering elements are applied.
- The general consensus point lies slightly to the right of and above the intersection of the X and Y axes. This suggests that there is some desire to both promote some commercial and residential development in the City, as well as for its population to embrace values of diversity and environmental sustainability.
- The greatest difference in both general perspective and consensus points can be found by filtering the results for 10 to 20 year-olds and 51 to 60 year-old. This suggests that some areas of generational disagreement exist on the key issues presented in the survey.


